Spectrum of hydrogen
At the time of Rutherford’s experiments, chemists analyzed chemical components using spectroscopy, and physicists tried to find what kind of order in complex spectral lines.
For example, a hydrogen arc tube containing hydrogen, a light element, shows a highly ordered spectrum compared with other elements.
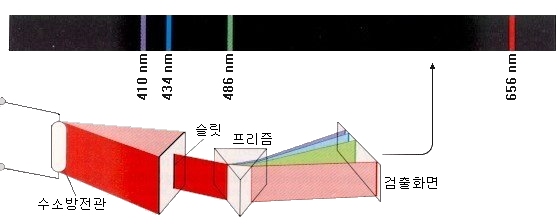
There is one line in the red area, one line in the cyan area, some lines in the purple area, and many lines in the ultraviolet region. Our eyes can not see the light in the ultraviolet region.
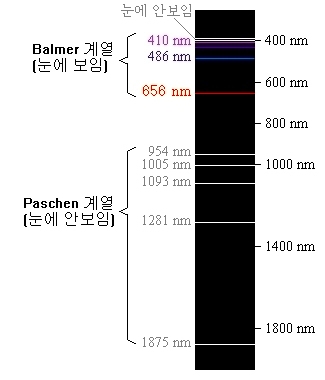
At the end of the 19th century, it was already discovered that wavelengths appearing in the spectrum of hydrogen atoms are clearly classified.
Balmer, a Swiss teacher, showed the position of the spectral line with a mathematical formula. But Balmer did not understand why this formula would happen. By using this method, we can forecast lines that we have not found yet.
\[ \frac { 1 }{ \lambda } =R(\frac { 1 }{ { 2 }^{ 2 } } -\frac { 1 }{ { n }^{ 2 } } )\quad \quad \quad n=3,4,5… \]
λ = wavelength of light(nm)
R = Rydberg constant( ≒ 1.097×10⁷m-1)
‘R’ is called ‘Rydberg constant.’ ‘R’ is the value of an electron’s potential energy, assuming that the electron is at infinity.
Quantum leap
Electrons in atoms absorb energy and can rise to high orbits.
The way to obtain energy is as follows.
- Collides with other atoms and absorbs some of kinetic energy
- Obtain kinetic energy after colliding with free electrons
- Absorb light energy
Conversely, electrons with high orbits can fall into low orbit and releasing energy (e.g., 5 → 2). At this time, energy is released in the form of light.
The electron orbit is only an integer value and can not be in between. For example, n = 3.2 can not be.
Therefore, only spectra of specific wavelengths are observed.
Spectrum series
The wavelength of light emitted depends on how far the electrons fall.
- Lyman series: the wavelength of the emitted light when high level electrons fall to the ground state(n = 1)
\[ \frac { 1 }{ \lambda } =R(\frac { 1 }{ { 1 }^{ 2 } } -\frac { 1 }{ { n }^{ 2 } } )\quad \quad \quad n=2,3,4… \] - Balmer series: the wavelength of the emitted light when high level electrons fall to the state of ‘n = 2’
\[ \frac { 1 }{ \lambda } =R(\frac { 1 }{ { 2 }^{ 2 } } -\frac { 1 }{ { n }^{ 2 } } )\quad \quad \quad n=3,4,5… \] - Paschen series: the wavelength of the emitted light when high level electrons fall to the state of ‘n = 3’
\[ \frac { 1 }{ \lambda } =R(\frac { 1 }{ { 3 }^{ 2 } } -\frac { 1 }{ { n }^{ 2 } } )\quad \quad \quad n=4,5,6… \] - Brackett series: the wavelength of the emitted light when high level electrons fall to the state of ‘n = 4’
\[ \frac { 1 }{ \lambda } =R(\frac { 1 }{ { 4 }^{ 2 } } -\frac { 1 }{ { n }^{ 2 } } )\quad \quad \quad n=5,6,7… \]
λ = wavelength of light(nm)
R = Rydberg constant( ≒ 1.097×10⁷m-1)